
- Chainlink slips to near $16, down 8% in 24 hours, testing key technical support levels.
- Trader data shows strong bullish bias with long-to-short ratios above 2.4.
- Analysts anticipate $15 could form a strong base for a potential move toward $100.
Chainlink is again testing its lower support levels following a sharp sell-off. As price action continues to tighten, analysts and traders are focusing on the $15 area as an accumulation zone in which LINK can potentially usher in a new phase of upward action.
Chainlink Trades Near Support After Sharp Correction
Chainlink is as of writing priced at $16.03, following a strong 24-hour drop of about 8% that extended its one-week losses to over 15%. The price correction emerged after an extreme intraday selloff saw LINK plummet from ranges above $17.45, signaling that short-term sentiment had indeed weakened.Nevertheless, from a wider market perspective, the move is still perceived to be a healthy re-test in a larger consolidation structure.
A multi-year symmetrical triangle chart that has existed since the middle of 2021 was shared by Ali (@ali_charts). The compression period before a potential breakout is indicated by the structure’s clearly defined lower highs and higher lows. The analyst suggests that a pullback toward the $15 zone could be a “golden buy opportunity” before LINK resumes its next expansion phase.
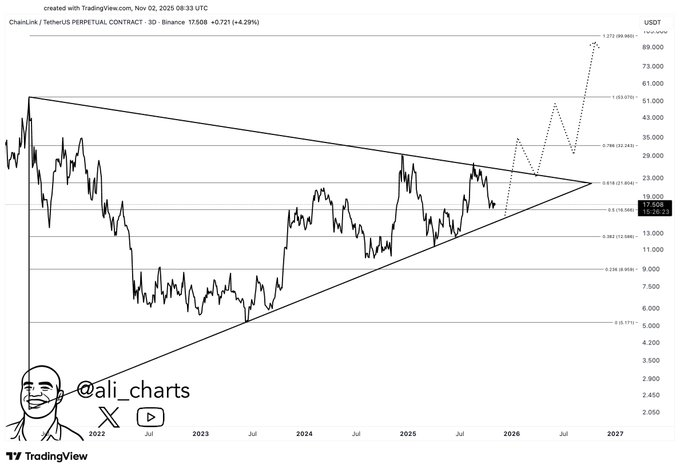
The lower boundary of the triangle lies close to the $15 level, which has previously acted as a key support in earlier retracements. A hold at this level confirms continuous accumulation and may ready the market for a decisive upward move.
Traders Hold Strong Long Bias Amid Weak Price Action
Even with LINK’s pullback, trading data from major exchanges indicates persistent bullish sentiment. On Binance, the long-to-short ratio sits at 2.43, showing that long positions still outnumber shorts by more than two to one. Top traders on the same exchange have an even higher ratio at 2.88, reflecting strong conviction that the market will recover.
The same pattern appears on OKX, where the ratio stands at 2.36, confirming optimism among traders. Meanwhile, open interest on Binance rose sharply—up 97%—as investors re-entered positions despite the short-term volatility. These metrics show that traders see the current weakness as a setup for recovery rather than a broader trend reversal.
Coinglass’ liquidation data reveals almost $670,000 in positions that have been cleared out in the last few hours, with almost $661,000 belonging to long traders. This flush of leveraged longs could indicate a washout event, after which the market can make way for steadier accumulation.
Technical Outlook Points to $15 as a Pivotal Zone
The broader technical setup shows Chainlink forming a base within a tightening range. Fibonacci levels drawn from the previous cycles point to future resistance targets at $43, $61, and $73, with a long-term extension level reaching $100. The price path suggested by analysts includes two stages—a recovery toward mid-level resistance, followed by another consolidation before a major upward move.
Market structure continues to favor a neutral-to-bullish stance as long as LINK holds above $15. Historically, the token has used similar dips as launching points during accumulation phases. The $15 region also matches the breakout zone seen in mid-2023, reinforcing its strength as a technical and psychological support level.
A decisive close above $20–$22 would confirm a breakout from nearly three years of compression. If supported by growing trading volume, such a move could mark the beginning of Chainlink’s next long-term expansion cycle. Until then, traders remain watchful, with the current pullback viewed as a chance to position for the next potential uptrend.


