

- A descending triangle in USDT.D / USDC.D may trigger capital flow from stablecoins into altcoins.
- Each prior breakdown in the ratio coincided with major altcoin rallies.
- Falling dominance indicates investors’ renewed appetite for higher-risk assets.
USDT.D / USDC.D is forming a descending triangle, a structure closely watched by traders as it may mark the next liquidity rotation phase in crypto markets. Historical breakdowns from similar setups have often preceded altcoin rallies.
Stablecoin Ratio Suggests Market Liquidity Shift
The chart shared by CryptoELITES shows the USDT.D / USDC.D ratio consolidating into a descending triangle, signaling a potential turning point in market liquidity dynamics. The ratio measures the combined dominance of Tether and USD Coin relative to the overall crypto capitalization.
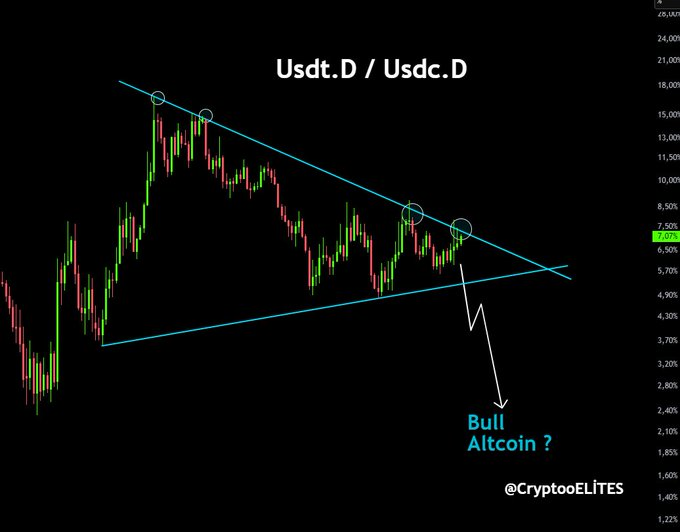
Currently, lower highs are forming against a firm support base, indicating steady selling pressure on stablecoin dominance. The repeated compression within this structure suggests weakening momentum among holders seeking risk-averse exposure. Historically, similar breakdowns have marked phases when investors redirected liquidity toward altcoins, fueling broad market upswings.
A decisive move below the existing support level could once again trigger such a rotation. This would reflect a shift from defensive capital positioning toward speculative activity, a typical characteristic of early bull cycle transitions.
Historical Behavior and Market Sentiment Alignment
Each previous instance of a descending triangle breakdown in the USDT.D / USDC.D ratio aligned with strong altcoin inflows. This correlation stems from investors converting stablecoins into higher-risk assets, reflecting increased market confidence and improved sentiment.
Bitcoin is characterised by mid-cycle rallies when it stabilizes or consolidates as capital moves to secondary assets. The identical trend can repeat itself in the event that the stablecoin domination falls below the present 7% mark, and liquidity can be directed to Layer 1 initiatives, DeFi tokens, and developing AI-powered cryptocurrencies.
Such formations are considered by market watchers as an indicator of common risk appetite. The ongoing compression therefore acts as an early indicator of whether traders are preparing to engage more aggressively with volatile assets.
Technical Outlook and Broader Context
From a technical standpoint, the repeated rejection at the descending trendline reinforces the notion of fading demand for stablecoins. The market’s failure to reclaim higher dominance levels implies persistent distribution pressure. A confirmed close below the triangle’s support could accelerate rebalancing across portfolios and automated trading strategies.
However, broader macroeconomic stability, liquidity inflows, and Bitcoin’s dominance will influence the magnitude of any subsequent rotation. If a breakdown occurs, increased volatility is likely, though history suggests it would favor the altcoin sector.
CryptoELITES’ observation points to a key inflection zone in the evolving crypto liquidity structure. The USDT.D / USDC.D pattern may thus serve as an early signal for renewed speculative momentum, contingent on whether the support level gives way..


