
- Ether maintains the position of over $3,850 with traders keeping track of the indicators of stability in a larger corrective framework.
- The large investors continue to purchase Ethereum even at the lowest point of the market and it indicates that they still have faith in it.
- Futures data indicate long traders are not laying low, indicating they expect levels to pivot and rebound from current levels.
Ethereum’s still feeling the heat after dropping below $3,900 recently. But, looking at how people are trading and the derivatives data, it seems like folks are expecting it to bounce back once the selling slows down.
Ethereum Stabilizes Within a Descending Channel
After the heavy selling, Ethereum is steady. The asset is still trading on a downward sloping channel that it has been following since the middle of September. This range is characterized by distinct lines of resistance and support and is an indication of a correction but not a break down.
One of the charts posted by Ali (@ali_charts) demonstrates that Ethereum is moving between the two channel boundaries. Black arrows have been used to indicate each reversal point, indicating recurrent lower band rebounds, and rejections at the top. The recent rebound took place near the level of $3,850, which has in the past served as a short run floor.
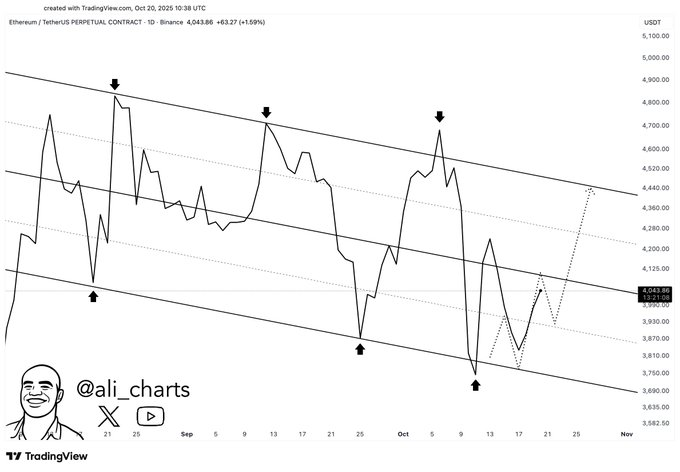
Ether is currently trading at around $4,038, a little above that support. The trend indicates that there is a potential to move upwards to the middle of the channel at approximately 4,250 and may then later retest the resistance at around 4,440. Analysts warn that once below the level of 3850, this structure would be nullified, however holding above would keep the recovery prospects alive.
Liquidity and Institutional Flows Active.
According to the CoinMarketCap data, Ethereum is currently trading at $3,877.34 which represents a decrease of 4.97% per day. Capitalization of the market is $467.98 billion and 24 hour trading volume is $38.07 billion. The volume to market-cap ratio of 8.21% indicates consistent market activity, despite price pressure.
The intraday data reveals a steep fall out of the point of $4074, and the majority of the fall was experienced overnight. The move is explained by analysts as liquidations in leveraged long positions and wider risk aversion in crypto markets. Nevertheless, the supply of Ethereum can be regarded as stable, with its circulating supply at 120.69 million ETH, which is the second-largest digital asset.
The decline seems to be softened by institutional involvement. According to Crypto Patel reports, around 203,826 ETH valued at approximately 800 million dollars are purchased by BitMine in the pullback. Massive purchases in a downward market usually indicate faith in the underlying fundamentals. This activity can assist the market as smaller traders react to short-term volatility.
Derivatives Data Shows Optimism Despite Decline
Data from Coinglass suggests derivatives traders are positioning for a recovery. On Binance, the ETH/USDT long-to-short ratio stands at 2.80, while top traders show a higher ratio of 3.29. At OKX, the ratio is 2.45, indicating a consistent bullish bias across major exchanges.
Despite Ethereum’s 4.8% daily decline, the persistence of long positions shows that traders expect stabilization near the lower channel. Many view the pullback as a temporary reset following weeks of overextended momentum. This divergence between sentiment and price often signals an early shift in market direction.
From a broader view, Ethereum remains constructive. It is up 16.36% year-to-year, 41.19% last year, and 115.9% six months. These indicators indicate that the long-term structure is not broken despite the short-term volatility. In case Ethereum manages to hold the support at the $3,850 mark, traders expect to see fresh efforts to attack the $4,440 resistance area in the coming sessions.


