
- Chainlink sustains key Gann Arc support, reflecting long-term market structure stability despite recent price corrections.
- $LINK records over 12% daily growth, signaling strong buying momentum and increased institutional market participation.
- Rising volume and stable liquidity suggest Chainlink may be preparing for a potential continuation toward higher resistance levels.
Chainlink ($LINK) demonstrates resilience as its weekly chart structure remains intact under the Gann Arc framework. Market data shows renewed buying pressure and a recovery in trading momentum following a strong upward session.
Gann Arc Holds as Chainlink Preserves Structural Integrity
The $LINK weekly chart continues to show technical alignment with the Gann Square and Gann Arc structure, which still serves as a dynamic support level. Since 2018, Chainlink has followed a defined cyclical path, moving in tandem with Gann time–price harmonics. The recent retracement around the $12 to $14 zone has respected the lower arc trend line, suggesting continued structural preservation.
Analyst Cantonese Cat (@cantonmeow) observed that the current compression between horizontal and diagonal levels on the chart forms a potential breakout base. The next reactive region lies between $10.50 and $11.00, which aligns with the 1/8 division of the existing Gann Square. This area historically attracts renewed accumulation from long-term market participants.

The overall structure remains balanced, showing neither extreme weakness nor sharp rejection. The Gann Arc continues to operate as a mathematical framework that maintains Chainlink’s cyclical progression. As long as weekly closes remain above the active arc, the long-term orientation stays constructive within the broader cycle.
Renewed Buying Interest Fuels Short-Term Market Recovery
Chainlink experienced a considerable increase in price movement, reaching $18.71 having experienced a gain of 12.2% in one trading day. The sharp increasing trend was accompanied by an increase of 126.88% in the daily trade of up to $1 billion. The company saw an improvement in market capitalization of $12.68 billion indicating stronger investor interest and revitalization.
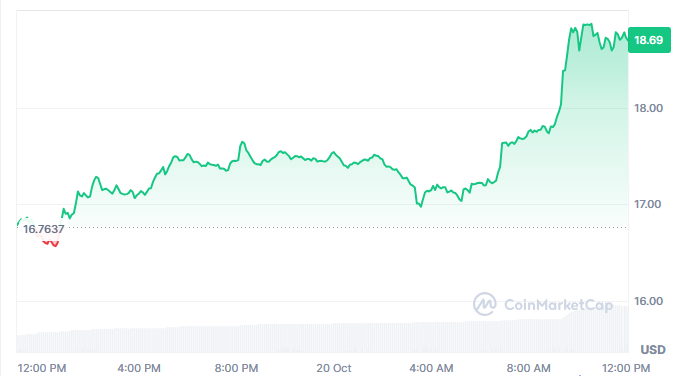
The price recovery has started around the level of $17.09 where the volume was around 556 million on the 19th of October, 2025. This area of support brought about a new wave of purchasing activity, which resulted in the final overcoming of the short-term resistance points. The action confirmed the short-term bullish control and made $LINK above important consolidation levels that had been observed in the past few sessions.
Chainlink on-chain sentiment analysis by traders like BuilderOG revealed that Chainlink was accumulating in a descending triangle pattern. The above breakout of above 17.80 proved the resurgence of upward force and the immediate continuation prospects of above 19 and above.
Liquidity Strengthens as Market Dynamics Stabilize
Chainlink currently has a supply of 678.09 million tokens out of one billion that maintains consistent inflationary price behaviors. A ratio of 8.37% to the Market Cap indicates good liquidity levels, and it will be stable when trading is high. This balance indicates that larger orders can be absorbed efficiently without extreme volatility spikes.
The consistent rise in both price and volume suggests that institutional participation has reemerged, aligning with cyclical accumulation patterns. The recovery from the $17 range toward $19 highlights improving confidence among market participants after a prolonged consolidation phase. Sustained trading above $18.50 would confirm ongoing strength within this structure.
If Chainlink maintains its trajectory above the current support levels, the next resistance clusters emerge near $20, followed by higher confluence zones at $45–$50 in the medium term. The Gann structure projects potential upper arc targets within $120–$160 over the next cycle, subject to broader market recovery and liquidity trends.


