- Cardano has fallen below its rising channel, leaving $0.1967 and $0.1808 as the next price levels traders may watch.
- ADA fell 4.1% in 24 hours to about $0.2073, losing more ground than Bitcoin during the reported market decline.
- A move above $0.2309 could improve ADA’s chart, while a fall below $0.1967 would expose lower support levels.
Cardano price action has turned weaker after ADA slipped beneath its rising channel, leaving traders to assess whether further losses will follow.
ADA’s Recent Recovery Loses Ground
More Crypto Online reported that ADA had broken below its rising channel’s support line. The four-day chart shows this break after a lengthy decline and a modest recovery. The latest move puts that recovery under pressure.
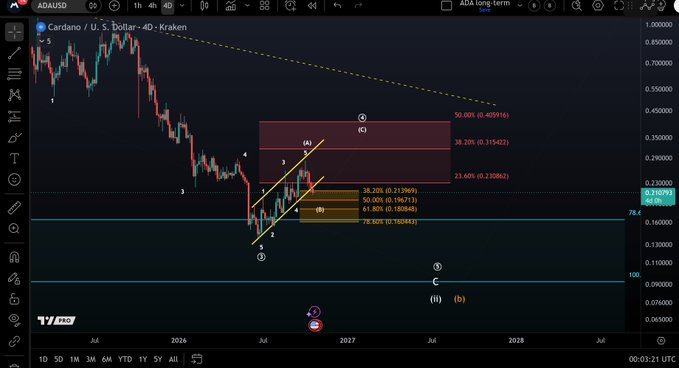
ADA traded above $0.85 before falling through successive lower highs and lower lows. By 2026, the decline had carried the token toward the $0.20 area. A rebound followed, but it failed to restore the earlier price structure.
During the rebound, two rising trendlines contained much of ADA’s upward movement. Buyers managed to lift the price within this narrow channel for a time. The latest drop beneath its lower boundary shows that support did not hold.
The broken line now matters during any recovery attempt. If ADA rises toward it but fails to cross back above, sellers may retain control. A quick move below the line alone, though, cannot settle the direction of the next major swing.
Lower Price Levels Come Into View
The technical chart indicates support levels below ADA’s current trading range at $0.1967, $0.1808, and $0.1555. The prices provided are only for reference if the drop continues. None guarantees that buying will emerge at that exact level.
A separate market data places ADA near $0.2073, down 4.1% over 24 hours. Its market value stood near $7.63 billion, with daily trading volume around $247.2 million. Volume was down 13.9%, though that figure alone cannot show whether sellers are losing strength.

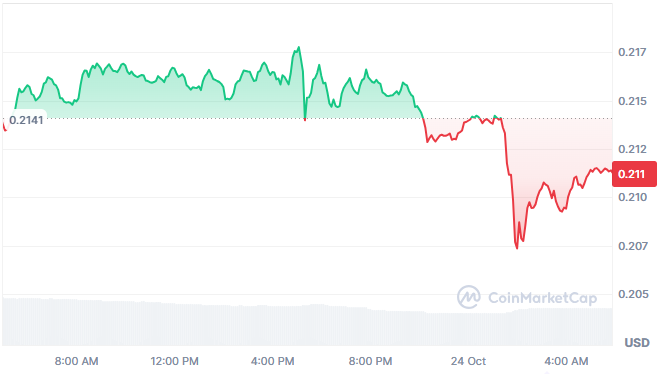
The $0.1967 mark is the first lower level to watch. If ADA holds there, the price could attempt to recover some recent losses. A clear break beneath it would bring $0.1808 into the picture.
The chart below indicates a second reference, near $0.1555, at lower levels. The longer range markings also include areas around $0.16 and $0.10. Those levels belong to the chart’s wider downside map, not a prediction that ADA must reach them.
Resistance Must Be Reclaimed
Above the current price, the chart marks resistance near $0.2309. ADA would need to recover that level to improve its short-term structure. A brief move above it would carry less weight than a sustained hold.
Higher chart levels sit near $0.3154 and $0.4059. Reaching either would require a sizable rise from the current market price. Each level could bring renewed selling after the recent channel failure.
The chart also includes numbered wave labels associated with Elliott Wave analysis. These labels represent one interpretation of the market’s sequence of rises and falls. The count may change as new price movements develop.
Bitcoin’s decline adds context to ADA’s weakness. On October 24, Bitcoin fell about 1.35%, compared with ADA’s 4.11% loss in the supplied figures. Cardano therefore suffered a steeper drop, though these numbers do not explain what caused it.
ADA’s next move will depend on how price behaves around the marked levels. A fall through $0.1967 would put lower support areas into view, while a recovery above $0.2309 would improve the chart’s near-term appearance. Until either occurs, the lost channel leaves the recent rebound on uncertain footing.