
- SUI’s 0.978-1.01 support zone faces pressure after repeated declines, while buyers have yet to establish a higher high.
- Binance leads seven-day SUI trading volume at $374.14 million, while exchange inflows remain mixed across major trading platforms.
- A break above $1.02 could improve SUI’s short-term structure, but losing $0.978 would expose the lower $0.929 retracement level.
SUI price action remains weak near $1.00, with traders watching support, exchange flows and resistance for evidence of a possible recovery.
SUI Approaches a Crucial Support Area
More Crypto Online identifies 0.978–1.01 as the micro support zone to watch this weekend. It’s chart suggests SUI is trying to move higher, but with no higher highs. This is important to understand, since a price bounce does not create a trend change.
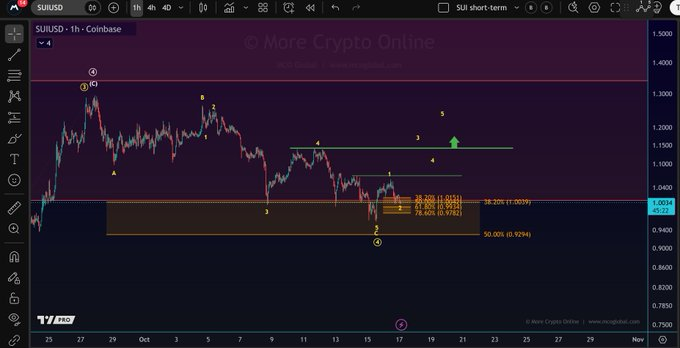
The drop comes after the highs of near $1.35 during the latter part of September. SUI subsequently formed lower highs as recovery attempts failed to regain earlier levels. During October, selling pushed the token below $1.10 and toward the $1.00 mark.
The latest chart places SUI around $1.0058, down 4.21% in the displayed snapshot. A shorter, intraday chart displays a 4.02% drop as price drops toward $1.00 from about $1.05. Both are weak, with the views presenting different snapshots.
The first question is whether there are any buyers who can support the band. A sustained hold would give SUI an opportunity to rally back up to near support. But, a fall below $0.978 would weaken the formation and introduce $0.929 Fibonacci retracement.
Exchange Activity Shows Mixed Capital Flows
The seven-day volume heatmap places Binance well ahead of competing exchanges. It recorded $374.14 million, compared with Coinbase at $124.93 million and OKX at $114.94 million. Bitget, Kraken and Gate follow with approximately $102.55 million, $99.71 million and $96.27 million.
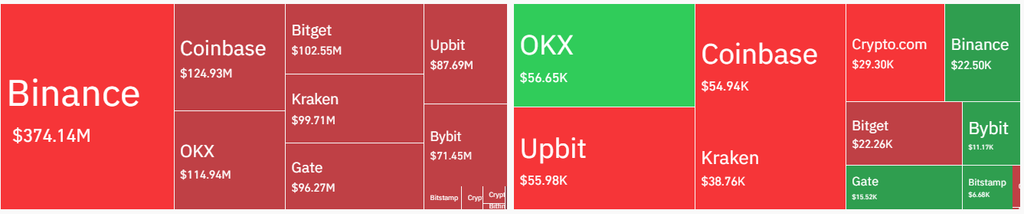
The net-flow figures tell a less uniform story across exchanges. OKX records a positive $56.65K, while Binance shows positive inflows of $22.50K. Bybit and Bitstamp also record positive readings of $11.17K and $6.68K.

Coinbase’s outflow is $54.94K, and Upbit’s outflow is $55.98K. Kraken is in second place with $38.76K, while Crypto.com comes in at $29.30K. These differences show that exchange-level flows are moving in opposing directions rather than following one clear pattern.
The derivatives figures also show considerable activity around SUI.24-hour futures volume on the list is $631.11 million, while spot volume is $122.13 million. Open interest stands at $736.58 million, but these numbers aren’t necessarily indicators of price expectations.
Resistance Levels Remain Important for Recovery
The short-term price chart places resistance near $1.02, following repeated failures to sustain rebounds. A move above this level could improve the immediate structure if SUI holds the gain. The next marked resistance areas on More Crypto Online’s chart sit near $1.08 and $1.15.
The Fibonacci levels provide additional reference points around current support. The chart marks levels near $1.015, $1.003 and $0.978, with the 50% retracement near $0.929. A loss of the support floor would place that lower level under closer scrutiny.
The numbered wave labels suggest a possible Elliott Wave count nearing a fifth-wave completion. However, the chart does not confirm that the decline has ended. Price would still need to form a higher high to provide clearer evidence of a changing trend.
Supply figures offer further context for the market’s valuation. SUI’s market capitalization stands near $4.14 billion, with 4.11 billion tokens circulating. Total and maximum supply both stand at 10 billion SUI, while fully diluted valuation reaches approximately $10.06 billion.
For now, the 0.978-1.01 zone remains the main short-term test. Holding support may provide buyers an opportunity to test resistance, but the trend is not confirmed. A further breakdown $0.978 would weaken the setup whilst a consolidation above the previous swing highs would offer further clarity of recovery.