
- SHIB trades inside a rising channel, with $0.00000600 marking the immediate resistance before the upper boundary near $0.00000640.
- Target numbers of $0.000888, $0.00888 and $0.0888 are all only theoretical, and well above the historical chart and peak.
- Positive Awesome Oscillator and MACD readings show improving momentum, but price still needs a sustained breakout above resistance.
SHIB market structure shows a developing recovery, with rising support and improving momentum placing resistance near $0.00000640 at the center of the latest chart setup on the daily timeframe.
Rising Channel Shapes the Current Market Structure
The recovery has developed through a sequence of higher lows since June. That pattern contrasts with the persistent decline visible during May and June. The ascending lower trendline now provides a clear reference for market structure.
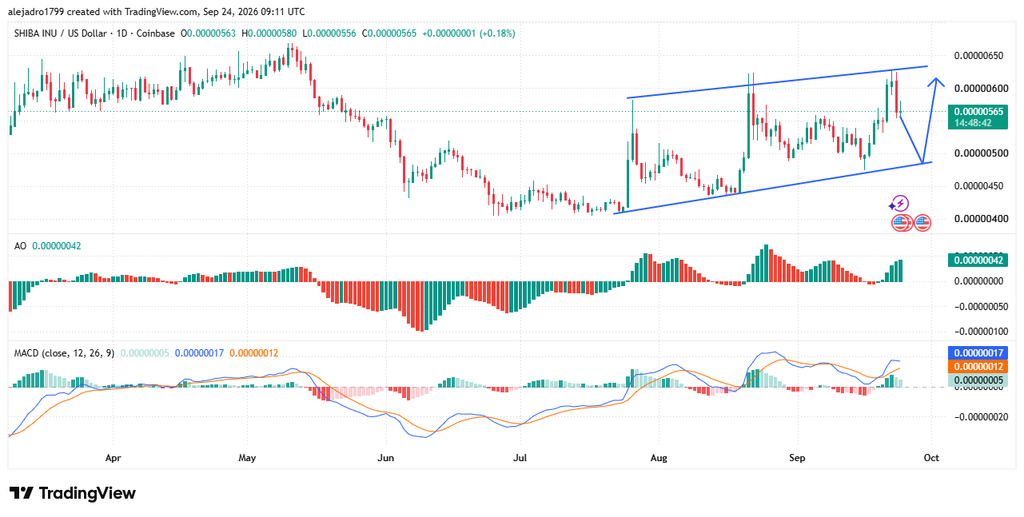
Support currently sits around $0.00000485-$0.00000500 on the chart. This zone has become important for maintaining the sequence of higher lows. A continuation of this contraction would take away the current recovery structure.
At the upper boundary, resistance extends toward $0.00000630-$0.00000640. Price recently breached the channel area but has since pulled back to $0.00000570. That reaction leaves the upper trendline as the immediate technical focus.
A daily close above that resistance would change the short-term chart structure. It would also confirm stronger demand above the existing channel boundary. Until then, the rising channel remains the clearest framework for interpreting price action.
Community Targets Contrast With Established Market Levels
In a recent post, $SHIB Bezos presented three ambitious milestones for the token. The sequence moved through $0.000888, $0.00888, and $0.0888. The accompanying “Practicing” message framed those figures as visualization rather than current prices.
$SHIB crosses $0.000888$ShibaInu crosses $0.00888$SHIB hits a new all time high of $0.0888
Practicing. pic.twitter.com/UhB3UkzxBC— $SHIB Bezos $SHIB $AMC $BKKT ToTheMoon INVESTOR 🪬 (@BezosCrypto) September 23, 2026

The first milestone would stand roughly ten times above the historical peak. That peak remains around $0.00008845 according to the supplied market reference. Therefore, the proposed sequence extends far beyond the established trading record.
Using the stated circulating supply, $0.000888 implies roughly $523 billion. The $0.00888 level would imply approximately $5.2 trillion. Those calculations show how rapidly valuation requirements expand between each milestone.
The final $0.0888 scenario would exceed $52 trillion under that supply assumption. These figures describe hypothetical valuations rather than technical forecasts from the chart. The post therefore presents a long-range visualization alongside current market analysis.
Momentum Indicators Show Improving Buying Pressure
The Awesome Oscillator has been positive for just under 0.00000042. Its recent green histogram bars show better short term momentum. The change comes after very negative readings in the previous sell-off.
The MACD also has a bullish setup on the daily chart. The MACD line stands near 0.00000017, above the signal line around 0.00000012. The positive histogram indicates that momentum has recently strengthened.
However, momentum indicators remain dependent on continued price confirmation. A rejection near $0.00000600 could return attention toward lower channel support. On the other hand, if it remains strong in battle, it would be more certain that it recovered.
For traders, the $0.00000485-$0.00000500 zone remains a key downside reference. The $0.00000600-$0.00000640 region remains the main upside test. These levels form the immediate stage of the range and larger targets are speculative.