- Bitcoin has entered a critical triangle apex and is in a repeatedly tested demand zone as it approaches.
- Funding rates remain positive despite weaker prices, showing renewed leveraged long positioning near support.
- Market focus remains on $60K support as traders assess breakout and breakdown scenarios ahead.
Bitcoin remains at a critical technical level as traders monitor support strength. Market attention has shifted toward a major demand zone while price compression continues within a long-standing chart pattern.
Bitcoin Holds Major Demand Zone Near Triangle Apex
Bitcoin started the week with a modest recovery from support. The move followed another test of a widely watched demand region. Traders continue monitoring price behavior near the triangle apex.
A recent CryptoBusy market update focused on this structure. The analysis identified a descending triangle since the $109,000 peak. Price has compressed steadily through months of lower highs.
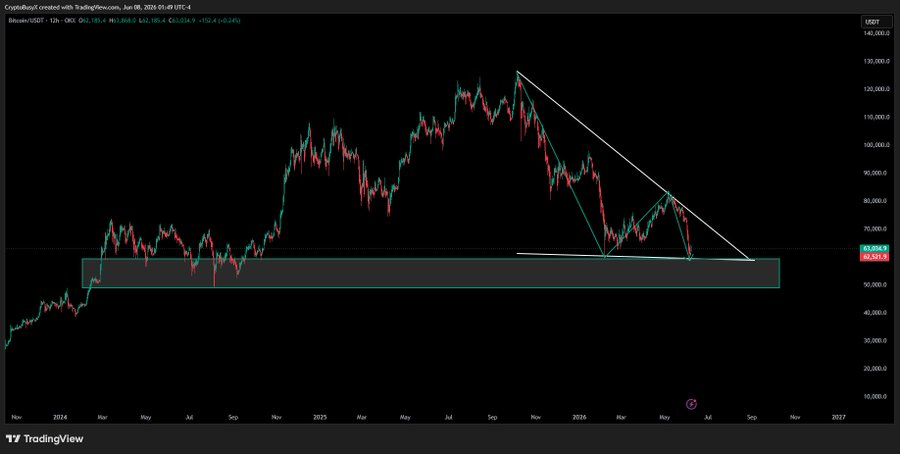
The chart shows that Bitcoin is in a range of support near $50,000-$65,000. Buyers have repeatedly defended this region since early 2024. Each previous test generated a meaningful market response.
Recent trading pushed price back into that area once again. Buyers responded quickly after the latest decline. The reaction preserved the broader support structure.
Historical Structure Keeps Market Participants Focused
The descending resistance line continues limiting recovery attempts. Lower highs remain visible across the higher-timeframe chart. Meanwhile, horizontal support has remained intact.
This combination forms a mature descending triangle pattern. Such structures often precede periods of stronger volatility. The current setup suggests a decisive move may be approaching.
CryptoBusy noted institutional activity below the $60,000 region. Historical trading behavior supports that observation. Large buyers previously entered during sharp corrections into this range.

Bitcoin as of the time of writing, trades at $63,094.38 after recent volatility. The asset gained 1.19% during the last 24 hours. However, it remains down 13.32% over seven days.
A follow-up CryptoBusy post referenced a previous breakout setup. According to the analysis, Bitcoin would hit $100,000. After a long consolidation period the target was reached.
Funding Divergence Creates Another Market Variable
Derivatives data shows another important element for traders. OI-weighted funding rates stayed largely positive during last year’s rally. That environment reflected strong demand for leveraged longs.
Market conditions shifted after the major peak formed. Bitcoin began creating lower highs across subsequent months. Funding rates nevertheless remained predominantly positive.
The divergence became more visible during the sharp correction. Price dropped from elevated levels toward the mid-$60,000 area. Funding briefly turned negative during liquidation-driven selling.
Recent data shows funding rates improving once again. Green readings have become more frequent near current levels. Yet price remains within a broader corrective structure.
The bullish scenario requires support to remain intact. A breakout above descending resistance could reverse the lower-high pattern. Traders would then watch for renewed momentum.
The bearish outcome is based on $60,000 being lost. This would open up the $50,000-$52,000 area. Market participants continue watching both levels closely.